Tracking Systems improve the economics of certain solar
projects
By Anthony Chico Pio Rebelo
chico.rebelo@sgurrenergy.com
Download as PDF
EXECUTIVE SUMMARY
Developers face a number of challenges when creating proposals for solar projects and
with the recent cancellation of power purchase agreements (PPAs) awarded to
recognised developers, none of these challenges is more relevant in today’s market
than the availability and acquisition of land. This consequently leads to the
question of whether to employ a fixed-tilt (FT) system or a horizontal single axis
tracker (HSAT) system to achieve desired energy targets.
SgurrEnergy India (SEI) recently addressed this question by performing an analysis
comparing the popular FT system to the HSAT system often used in the U.S.
INTRODUCTION
Solar photovoltaic (PV) modules are secured on mounting structures that provide structural
support and keep them oriented in a direction that allows them to receive maximum sunlight.
The tilt angle is optimized for site conditions of the given location. In India, most of
these systems are fixed tilt (FT) systems that do not move. However, PV panels can be
mounted on tracker systems that move throughout the day to keep the PV panels oriented
toward the sun and at the optimal angle for productivity. There is no other single
balance-of-system (BOS) component that can increase a PV system’s performance like a
tracker. Tracking systems can increase generated output by 10% to 25% compared to FT
mounting structures, but they can come with drawbacks in the form of site preparation costs
and moving parts that can require specialized maintenance.
Within the tracker systems group, there are two main subcategories; single-axis trackers that
turn on one axis and dual-axis tracking systems that turn on two axes. Single-axis trackers
are further subdivided into vertical single axis trackers, tilted single axis trackers, and
horizontal single axis trackers (HSAT). The following analysis performed by SEI focuses on
comparing HSAT systems to FT systems.
COMPARING THE TWO SYSTEMS
The SEI analysis compares the price, components, and performance of a 1.9MW FT system to a
1.2MW HSAT system. Simulations of both systems were set up using identical conditions on a
five-acre sample area in the high resource region of Bhadla in Rajasthan, India. SEI used
the photovoltaic simulation software PVsyst to optimize the layout and operational
parameters for each mounting system and simulated results were gathered for a one-year
period.
The question of which system would be most economical yielded mixed results for the sample
area. Although the FT system would generate approximately 34% more energy (P50 generation)
than the HSAT system and deliver a superior ground coverage ratio (GCR), the higher capacity
means that the FT system needs twice the number of inverters, which raises the installation
price by INR 10 million. This suggests that the HSAT system could be the more affordable
option, but the analysis did not consider the land specifications needed for an HSAT system
to function at its best and, by extension, the potential site preparation costs.
The SEI analysis compared FT and HSAT systems by looking at the following key factors
affecting solar project pricing and generation outcomes under identical conditions. These
are:
- Energy yield
- Ground coverage ratio (GCR)
- Inverter loading
- Quantum of module
- Balance of system (BOS) cost
The plant layout was configured to account for the influence of land boundaries and general
topographic conditions on system configurations. In certain cases, land conditions can have
a significant impact on mounting system installation costs. For instance, since HSAT system
function best on a land gradient of 3° or less, costly land levelling procedures could be
required before installation at certain sites.
Simulation results were recorded and the key factors of the two systems were compared.
Current market tariffs and rates were then applied to the simulated results.
In Error! Reference source not found. below, the main parameters of an FT system were
compared with those of an HSAT system and presented as a percentage increase or decrease.
Similarly, the financials were computed using current unit prices and tariffs.
It must be stated that this is a high-level analysis that only considers basic assumptions.
Unit prices and tariffs are vary widely based on product suppliers, installation regions,
and local government policies.
| Parameters |
Fixed Tilt System |
HSAT Comparison Expenditure/revenue variation (INR)1 |
| Maximum DC capacity (number of modules) |
48.89% |
-188,16,000 |
| Number of inverters |
50.00% |
-10,00,000 |
| Inverter loading |
-0.68% |
- |
| Energy Generated |
34.11% |
5,88,75,126 |
| Ground coverage ratio (GCR) |
49.00 |
-2 |
| Balance of System Cost (BOS) |
343.91% |
-4,03,86,386 |
| Land development |
- |
- |
Table-1: Comparison of the initial development costs of a fixed tilt (FT) system versus a
horizontal single axis tracking system (HSAT) system
| Parameters |
HSAT |
FT |
| Energy generated (kWh) |
2,500,695 |
3,353,643 |
| Lifetime energy generation3 (kWh) |
57,537,205 |
77,162,247 |
| Ground coverage ratio (GCR) |
38.3% |
57.1% |
| DC capacity (kWp) |
1,280 |
1,907 |
| Number of module |
4,000 |
5,960 |
| AC capacity (kW) |
1,000 |
1,500 |
| BOS (INR) |
11,743,158 |
52,129,544 |
1. Negative values indicate a higher expenditure for FT systems.
2. Land prices fluctuate by state, utilization, social significance and topographic
conditions.
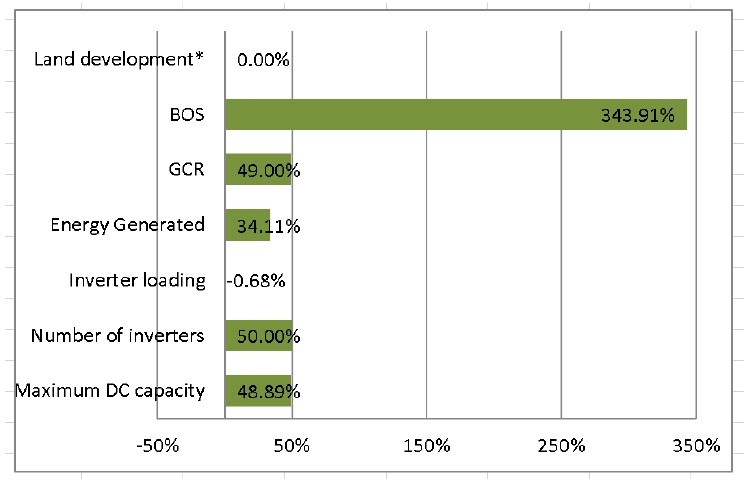
Figure 1: FT cost relative to HSAT
DECIPHERING THE DATA
SEI’s analysis of the simulation information allowed the following deductions to be drawn:
- A FT system offers multiple module racking possibilities, with the possibility of
achieving a higher DC power density in each area. Mounting options, such as tilt, are a
function of the location of the project. In the simulation exercise, the FT system
accommodated an array capacity that was approximately double that of the HSAT system on
the considered land parcel. This extra FT installation capacity was made possible by an
additional investment of close to INR 19 million, assuming a unit price of INR 30/Wp.
- Inverter loading is designed to handle the associated peak direct voltage (DC) capacity
of a system. Since the FT system can accommodate almost double the array capacity of the
HSAT system, it follows that the alternating current (AC) system would double too,
meaning that twice the number of inverters will be needed for an FT system.
Using the
current inverter rate of INR 2/W, the additional AC capacity required translates
into an
additional expenditure of INR 10 million for the FT system.
- Ground coverage ratio (GCR) is defined as the ratio of the PV module area to the land
area utilized. This ratio is ideally kept as high as possible. Tracking systems like the
HSAT tend to use more land because units must be spaced out further apart to keep them
from shading one another as they track the sun, which increases land use and the
associated land costs for the developer. Tracker manufacturers recommend a maximum land
gradient of 3° for deployment of HSAT systems, which means these systems may require
additional land preparation costs for levelling, grading, and cutting. HSAT systems can
be difficult to install in the randomly shaped plots typical of PV plants. Due to the
tilt and the mounting arrangement chosen for the study, the FT system returned a
GCR
that was almost double that of an HSAT system.
- Although module prices still constitute a large chunk of total project cost, the drop
in module prices in recent years has made the balance of system (BOS) cost an
increasingly significant component of overall project cost. To quantify this expense,
SEI’s research considered the BOS costs of previously executed projects that were
developed by different developers at different locations. Since it was possible to
install a higherpeak capacity within the predefined land boundaries using FT
architecture, this translated into a higher BOS cost for the FT system. In fact, the
cost for the FT system was approximately 4.4 times higher than that of a comparable HSAT
system.
- Return on investment (ROI) is represented by the energy generated. This parameter
results from all project specifics ranging from the selection of the location, or solar
resource, to O&M strategies like module cleaning. In the analysis, wherever possible,
similar losses were considered so that performance could be evaluated on a level
platform. In real plant design parameters, the actual generation ratio may vary.
In the
analysis, the FT system generated approximately 34% more energy (P50 generation).
This
implies that the surplus generation of the FT system will be higher than that of the
HSAT system over a 25-year period. The study used an annual degradation
guaranteed by
most Tier-1 module manufacturers.
- Among other findings, it was discovered that the unit price of each system varies based
on the manufacturer. For example, systems developed in China or made locally in India
are less expensive than similar systems from European manufacturers. Another component
affecting installation economics is the wide variation in tariffs for different areas.
Though tight margins and higher land development costs for the HSAT system has made FT
systems more popular, the study results indicate that there are instances where the HSAT
system makes sense under current tariff structures.
Results showed that developing the 1.9MW FT system would be more expensive than developing
the 1.2MW HSAT system. However, the study did not consider land development costs or
the long-term O&M cost of trackers. Tracking systems tend to need maintenance
more often due to their moving parts and in places where labor costs are high and spare
parts are not readily available, this can meaningfully impact project economics. These
factors could swing the outcome in favour of a FT system under a different set of
conditions.
HSAT SYSTEM IS BEST UNDER CERTAIN CONDITIONS
The analysis found in favour of the HSAT system, but not without its caveats. Tracker
technology is relatively new and the long-term performance of these systems is still being
determined. Durability tests on HSAT components are addressing some of these concerns and
manufacturers are building up their service capabilities. However, until those capabilities
exist, the failure of a tracking system can cause longer than expected downtime due to
reasons such as the limited availability of spare parts. No such drawbacks exist for FT
systems under normal conditions. Module cleaning for HSAT systems could be simplified and
made faster by optimally tilting the modules, but robotic cleaning is not yet available.
CONCLUSION
The question of which type of mounting system is best for a project must be evaluated on a
case-by-case basis that takes various factors into account. What is most efficient and cost
effective for one project may not be the best choice for another. Independent power purchase
agreements (PPAs) would be wise to take these factors into consideration.
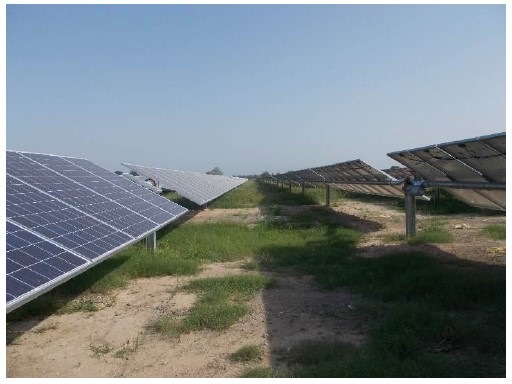
Solar PV plant with HSAT installation
Download as PDF